Now you’re two code lines away from gaining real-time access to world financial exchanges. This tutorial will show you how to install the Python library and use its main features.
- Production ready. Data available in
pandas,jsonandcsvformats. - Technical analysis. About 100 available and ready-for-use technical indicators.
- Unique experiences. Static and interactive charts from the same source as financial data.
- Any complexity. Many subsidiary methods to build from simple applications to ML & AI projects.
This library is absolutely free to use and immediately provides access to all methods. You will also need a personal API Key.
Install
Download module from PyPi
pip install twelvedata
If you need additional modules, e.g., for charting - list them in square brackets
pip install twelvedata[matplotlib,plotly]
Usage
The base object for all method calls is TDClient. We can define this only once at the beginning and use it throughout the whole application.
from twelvedata import TDClient
td = TDClient(apikey="your_api_key")
Access Time Series
We get time-series data by calling the appropriate object. Pass necessary parameters and use it as a template for future calls, without the necessity of defining it again, unless some parameters have to be modified.
ts = td.time_series(
     symbol="MMM",
     interval="5min"
).as_pandas()
Access Technical Indicators
All technical indicators are called on top of time_series(...) object, following .with_{technical_indicator_name} format. Custom parameters may be passed, if not - defaults are taken.
Full list of technical indicators and it's parameters is available at TI Documentation or at get_technical_indicators_list() endpoint.
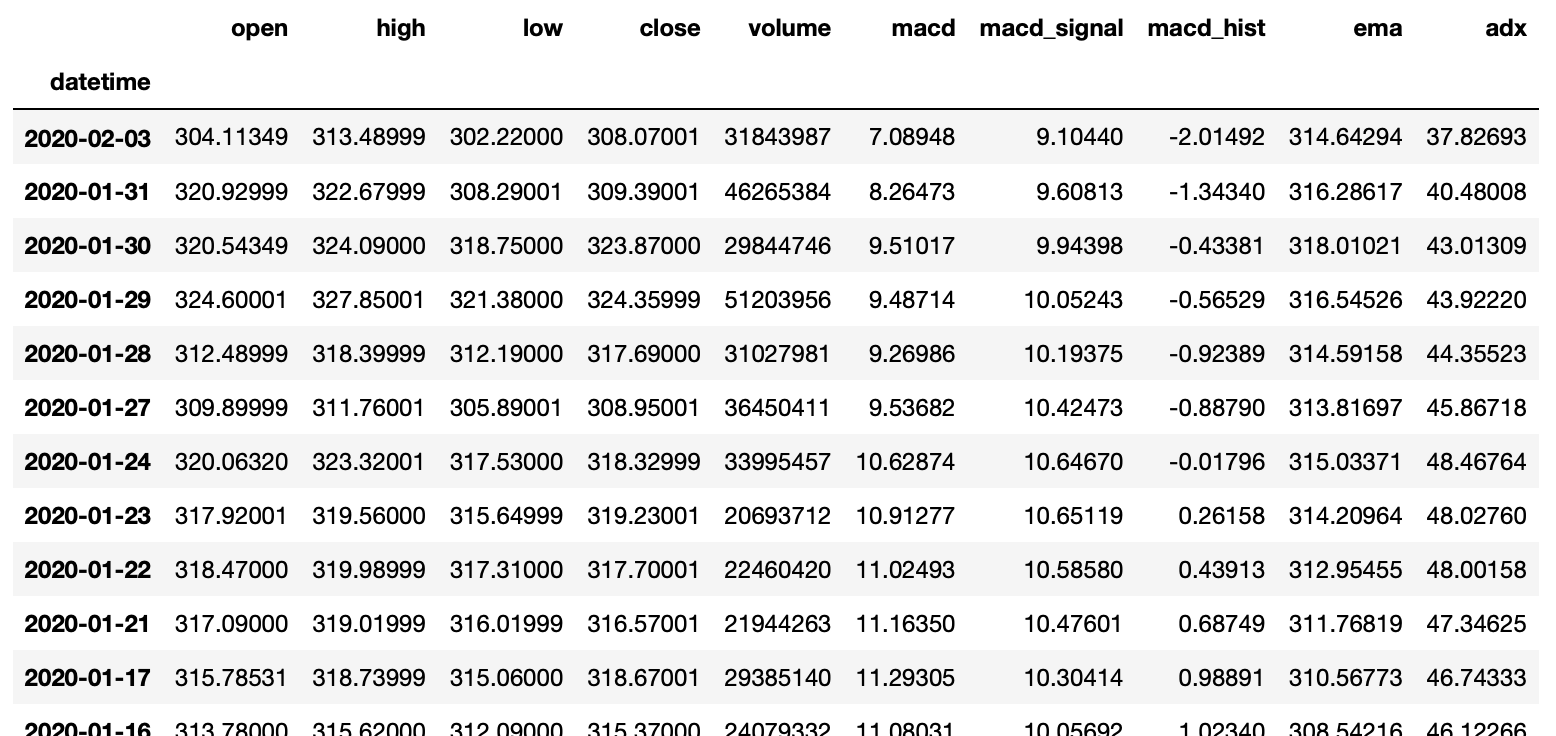
ts.with_macd().with_ema(time_period=20).with_ema(time_period=50).as_csv()
Format Control
.as_pandas()
Returns pandas.core.frame.DataFrame object which can be used for Machine Learning and other programs that require extensive data manipulation.
.as_json()
Is the most popular choice for the majority of applications with non-complex data usage.
.as_csv()
Suits programs that need to easily convert data to human-readable format.
.as_pyplot_figure()
Returns matplotlib.figure.Figure object which might be rendered as ready static chart.
.as_plotly_figure()
Returns plotly.graph_objs._figure.Figure object which might be rendered as ready interactive chart.
Dates Control
Custom dates and output size parameters might be passed to time series object.
To select the most recent 25 data points, use outputsize parameter.
ts = td.time_series(
     symbol="ETH/BTC",
     interval="30min",
     outputsize=25
).as_pandas()
To select all data between 2020-01-01 and 2020-02-01, we set date parameters.
ts = td.time_series(
     symbol="ETH/BTC",
     interval="30min",
     start_date="2020-01-01",
    end_date="2020-02-01"
).as_pandas()
Both outputsize and dates parameters may also be used simultaneously.
Advanced Control
In order to get DateTime value in a convenient form, the timezone parameter might be specified.
ts = td.time_series(
     symbol="CHF/GBP",
     interval="60min",
    timezone="Europe/Zurich"
).as_pandas()
Stocks also accept exchange and country parameters, while cryptocurrencies support only exchange.
ts = td.time_series(
     symbol="BTC/USD",
    interval="60min",
    timezone="Asia/Singapore",
    exchange="huobi"
).as_pandas()
For other acceptable parameters you may refer to API Documentation
Reference Data
Reference Data endpoints are called directly from TDClient object. Majority of them might be converted either to .as_json() or .as_csv() formats.
# Stocks List in CSV format
td.get_stocks_list().as_csv()
# Stock Exchanges List
td.get_stock_exchanges_list()
# Forex Pairs List
td.get_forex_pairs_list()
# Cryptocurrencies List
td.get_cryptocurrencies_list()
# Cryptocurrency Exchanges List
td.get_cryptocurrency_exchanges_list()
# Technical Indicators Interface is only available in JSON
td.get_technical_indicators_list().as_json()
Source code is available at GitHub repository.


